elemapprox -- The Rosetta stone of elementary functions approximation and plotting
Going back to my HDL development/design projects, I’ve been having fun working with elemapprox, a multi-language collection of modules and packages to assist in simulating floating-point hardware. It is kind of a Rosetta stone for elementary functions approximation adding basic plotting facilities as ASCII (low-resolution) and PBM (monochrome) bitmaps (higher res). Available ports include ANSI C, Verilog, VHDL and "VHDLIEEE" (perusing the existing approximations in the IEEE.math_real package). The data type used for the computations is Verilog’s and VHDL’s real.
This code has been tested with Icarus Verilog, GHDL and Modelsim (VHDL only). The Verilog driver module (testfunc.v) makes advanced use of Verilog system functions and tasks. By using this strong feature of Verilog, I was able to closely imitate the operation of the driver code (testfunc.c) from the ANSI C version. Development of the test driver for the VHDL version was not that straightforward and had to bypass some VHDL quirks; for instance the handling of variable-length strings.
The complete code is here: http://github.com/nkkav/elemapprox and is licensed under the Modified BSD license.
My motivation was to extend the original work on evaluating (single-precision) and plotting transcendental functions as discussed in Prof. Mark G. Arnold's HDLCON 2001 paper.
At this point my version adds support for all trigonometric (cyclic), inverse trigonometric, hyperbolic and inverse hyperbolic functions as well as a few others: exp, log (ln), log2, log10, pow. I will be adding more functions in the future, for instance hypot, cbrt (cubic root) as well as other special functions that are of interest.
With using any of the versions of elemapprox (whether ANSI C, Verilog or the VHDL ones), you can easily plot the arctangent as ASCII:
......................................................****************
.............................................**********...............
..........................................****........................
........................................***...........................
.......................................**.............................
......................................*...............................
.....................................*................................
....................................**................................
...................................**.................................
...................................*..................................
..................................**..................................
.................................**...................................
.................................*....................................
................................*.....................................
..............................**......................................
............................***.......................................
.........................****.........................................
................**********............................................
*****************.....................................................
......................................................................
or as a PBM bitmap file (for much higher resolution):

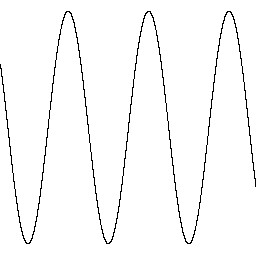
Or you can plot your typical sine:

You can always configure elemapprox to suite your needs: write your own function approximations, plotting routines, etc..
In the end: use the source Luke! Besides that, there is also some documentation (thankfully) to get you started, or just browse the README directly at the project's Github repo or just drop a note here.
I really hope that the community will find this work useful!